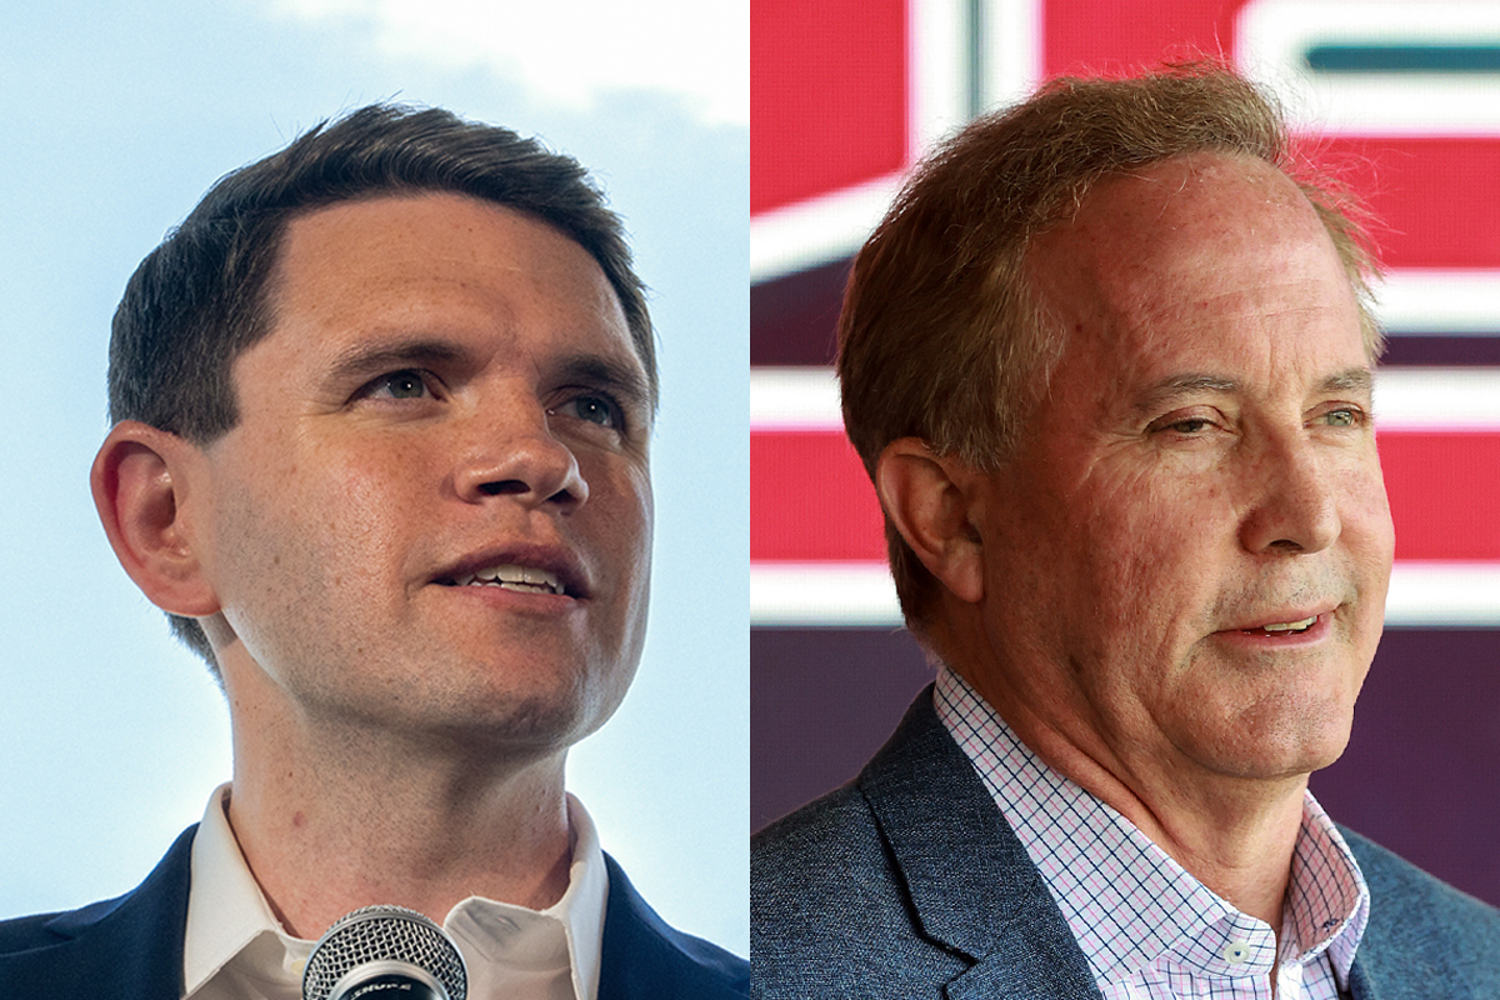
Standard political journalism treats pre-election polling snapshots as predictive scoreboards rather than diagnostic instruments of voter friction. When late-September 2026 surveys placed Democratic challenger James Talarico narrowly ahead of Republican Attorney General Ken Paxton in the Texas U.S. Senate race while simultaneously showing Republican incumbent Greg Abbott leading Democratic challenger Gina Hinojosa for governor, mainstream coverage framed the divergence as a simple anomaly of candidate popularity. That framing misses the underlying structural mechanics. A split topline inside a single statewide sample does not represent a stable equilibrium of ticket-splitting voters; it measures an unresolved tension between partisan gravity and candidate-specific defection risk.
To evaluate why pre-election surveys registered a split verdict—and why actual November 2026 ballots resolved that tension decisively rather than splitting the top of the ticket—analysts must separate topline horse-race numbers from the structural variables that govern voter consolidation. In related developments, read about: Why Sueing the White House Over Press Access is a Complete Waste of Time.
The Structural Flaw in Horse-Race Polling Coverage
Conventional polling summaries rely on three surface metrics: the raw topline spread, the margin of sampling error, and an undifferentiated pool of undecided respondents. When a survey reports a three- or four-point margin inside a plus-or-minus four-point sampling error, standard reporting declares the contest a statistical dead heat and moves on.
This approach fails because sampling error only quantifies random variance around a static sample; it does not measure directional elasticity among cross-pressured voters. In a polarized statewide electorate, two races sharing the exact same pool of likely voters cannot operate as independent markets indefinitely. Every voter entering a booth carries a baseline partisan utility function, modified by candidate-specific friction. Reuters has provided coverage on this fascinating subject in extensive detail.
The Three Pillars of Ticket Divergence
When top-of-the-ticket surveys show opposing party leaders ahead in the same state, three distinct mechanisms are interacting:
- Asymmetric Candidate Friction (Negative Partisanship vs. Personal Drag): In the 2026 Texas cycle, the Republican ticket paired a three-term incumbent governor with a Senate nominee who had just emerged from a bruising primary runoff against incumbent Sen. John Cornyn. Survey data from the cycle consistently reflected higher net unfavorable ratings for Paxton than for Talarico, creating localized friction among moderate and establishment-aligned conservatives who remained comfortable with Abbott.
- Differential Name Recognition and Persuasion Ceilings: Incumbent governors possess near-universal statewide name recognition and established constituent baselines, which compress the pool of persuadable voters early in the cycle. Conversely, challengers in open or post-primary Senate contests experience wider variance in early awareness, leaving a larger share of soft partisans parked in the "undecided" or third-party columns during September surveys.
- Likely Voter Screen Distortion: Pre-election polls apply turnout filters based on historical midterm participation models. When a cycle features record-shattering financial deployment—over $500 million in advertising in the Texas Senate contest alone—and massive shifts in urban and suburban mobilization, historical turnout screens systematically underweight surge electorates.
The Cost Function of Ticket Splitting in Polarized Electorates
To understand why early polling gaps between a Senate race and a gubernatorial race rarely survive contact with Election Day, political strategists model ticket splitting as a behavioral cost function. For a voter to cast a ballot for one party's Senate candidate and the opposing party's gubernatorial candidate, the perceived ideological or character penalty of their own party's nominee must exceed the psychological and partisan cost of crossing party lines.
In September 2026 polling, that threshold appeared to be met for a small cohort of center-right Texas voters. While majorities of partisan voters stayed locked within their respective columns—with late-cycle polling showing roughly 95% cross-ballot alignment between Abbott and Paxton supporters, and similarly high alignment between Talarico and Hinojosa supporters—the remaining single-digit sliver of cross-pressured voters was enough to produce divergent toplines in early autumn snapshots.
However, ticket splitting is an unstable state. As Election Day approaches, two forces compress that divergence:
- Information Saturation: High-volume paid media nationalizes down-ballot and state-level races, reminding hesitant partisans of the broader ideological stakes attached to each party label.
- Partisan Re-Sorting: Voters who initially express reluctance toward a polarizing nominee of their own party either return to the partisan fold out of opposition to the opposing party's platform, or abstain from the race altogether rather than actively voting for the rival party.
Diagnostic Framework for Evaluating Divergent Statewide Polls
Practitioners analyzing multi-race statewide surveys should replace topline comparisons with a four-step diagnostic audit.
Step 1: Isolate the Undecided and Third-Party Pool
Never compare a 47%–43% margin in one race directly against a 46%–45% margin in another without accounting for the remaining non-major-party share. In September and October 2026 Texas polling, minor-party candidates—including Libertarian Senate nominee Ted Brown and Libertarian gubernatorial nominee Pat Dixon—alongside undecided voters accounted for 6% to 10% of the sample. A candidate leading 49% to 46% sits one point away from a majority threshold, whereas a candidate leading 47% to 43% requires nearly a third of the remaining undecided pool to clear 50%.
Step 2: Cross-Tabulate Intra-Ticket Retention
Measure the retention rate between the top two races rather than looking at overall party averages. In late-October polling of the Texas electorate, 99% of Hinojosa voters backed Talarico, while 95% of Talarico voters backed Hinojosa. On the Republican side, 95% of Abbott voters backed Paxton. When cross-tabulations reveal asymmetric retention—such as the 27% of voters holding a favorable view of outgoing Sen. John Cornyn who indicated support for Talarico—analysts can pinpoint the exact demographic or ideological fracture driving the topline gap.
Step 3: Benchmark Registered Voter Samples Against Likely Voter Screens
Early autumn surveys frequently report results among all registered voters alongside or instead of strict likely voter models. Registered voter samples routinely overestimate Democratic performance in Texas by capturing lower-propensity urban and younger cohorts who fail to clear midterm turnout screens. Comparing the spread shift between registered and likely voter cohorts reveals whether a candidate's lead relies on persuasion or raw turnout expansion.
Step 4: Audit Regional Vote-Margin Concentration
Statewide percentages obscure geographic mechanics. In Texas, statewide outcomes depend on the ratio between urban margin generation (Harris, Dallas, Tarrant, Bexar, and Travis counties), suburban swing compression (Collin, Denton, and Fort Bend counties), and rural margin defense. A poll showing a narrow statewide margin tells strategists nothing unless the underlying regional subsamples reflect realistic turnout weights across these three geographic tiers.
Empirical Validation: How the November 2026 Electorate Resolved the Split
The actual results of the November 3, 2026 Texas general election provide a stark case study in why pre-election split-ticket narratives fail under high-turnout mobilization.
Rather than producing a split verdict—a Democratic U.S. Senator paired with a re-elected Republican Governor—the electorate moved in a unified band across the statewide ballot:
- U.S. Senate: James Talarico defeated Ken Paxton by roughly 12 percentage points (55.1% to 43.0%, with over 5.44 million votes for Talarico to Paxton's 4.25 million).
- Governor: Gina Hinojosa defeated incumbent Greg Abbott by roughly 7.1 percentage points (52.8% to 45.7%, a margin exceeding 700,000 votes).
- Down-Ballot Consolidation: Democratic candidates swept the remaining contested statewide executive offices—including Lieutenant Governor, Attorney General, Comptroller, Land Commissioner, Agriculture Commissioner, and Railroad Commissioner—demonstrating that ticket splitting was negligible at scale.
The discrepancy between September's narrow polling margins and November's multi-point statewide sweep exposes two structural blind spots in standard polling analysis:
- Underestimated Urban and Suburban Turnout Elasticity: Pre-election likely voter models calibrated to historical Texas midterms failed to anticipate the scale of advance and Election Day turnout in core urban counties and fast-growing suburban counties like Collin, Denton, and Fort Bend.
- Coattail Inversion: Standard political theory assumes top-of-the-ticket executive races pull down-ballot legislative candidates upward. In 2026, the dynamic inverted. The nationalized, $500 million Senate contest generated an unprecedented mobilization apparatus that lifted the entire Democratic statewide slate, erasing Abbott's early incumbent advantage rather than allowing Abbott to pull Paxton across the finish line.
Operational Limitations of Polling Models in High-Variance Cycles
Even rigorous diagnostic frameworks face hard methodological boundaries during realignment or wave cycles:
- Non-Response Bias in Polarized Environments: Survey response rates remain chronically low, and partisan differential non-response fluctuates dynamically with news cycles. When one party's base experiences heightened enthusiasm or frustration following a primary runoff, pollsters struggle to weight sample composition accurately without over-correcting.
- Late-Deciding Voter Homogeneity: Standard polling models assume undecided voters split roughly evenly or break marginally against the incumbent. In reality, late-deciding voters in high-salience environments tend to break overwhelmingly in a single direction once partisan cues solidify in the final 72 hours.
- Static Weighting on Dynamic Geographies: Weighting samples by past presidential or midterm vote recall locks models into yesterday's electorate. When rapid demographic shifts and localized issue salience—such as infrastructure and economic pressures in suburban corridors—alter turnout propensity, historical weighting actively suppresses real-time movement.
The Strategic Play for Campaign and Media Analysts
Stop treating single-race polling toplines as standalone forecasts. Whenever pre-election surveys in a polarized state show divergent leads between a federal Senate race and a statewide gubernatorial race, treat the gap as a temporary measurement of voter hesitation rather than a permanent coalition.
Operationalize this insight in three ways during future cycles:
- Track Cross-Ballot Correlation Over Topline Spreads: Measure the delta between the two top-of-the-ticket races in every consecutive poll. A narrowing gap between the stronger and weaker candidate of the same party signals partisan consolidation, indicating that the trailing candidate is converging toward the leader's ceiling rather than the leader collapsing toward the challenger.
- Weight Regional Turnout Over Statewide Percentages: Discard statewide toplines that lack transparent regional breakdowns across urban cores, inner-ring suburbs, exurbs, and rural counties. Track early-vote and mail-in ballot share by county tier against prior baseline midterms to detect turnout surges before Election Day.
- Model Coattail Directionality by Financial and Media Volume: Identify which race commands the dominant share of paid media and field infrastructure. In modern polarized elections, voter mobilization flows from the highest-salience contest downward—regardless of whether that race sits at the federal or state level.