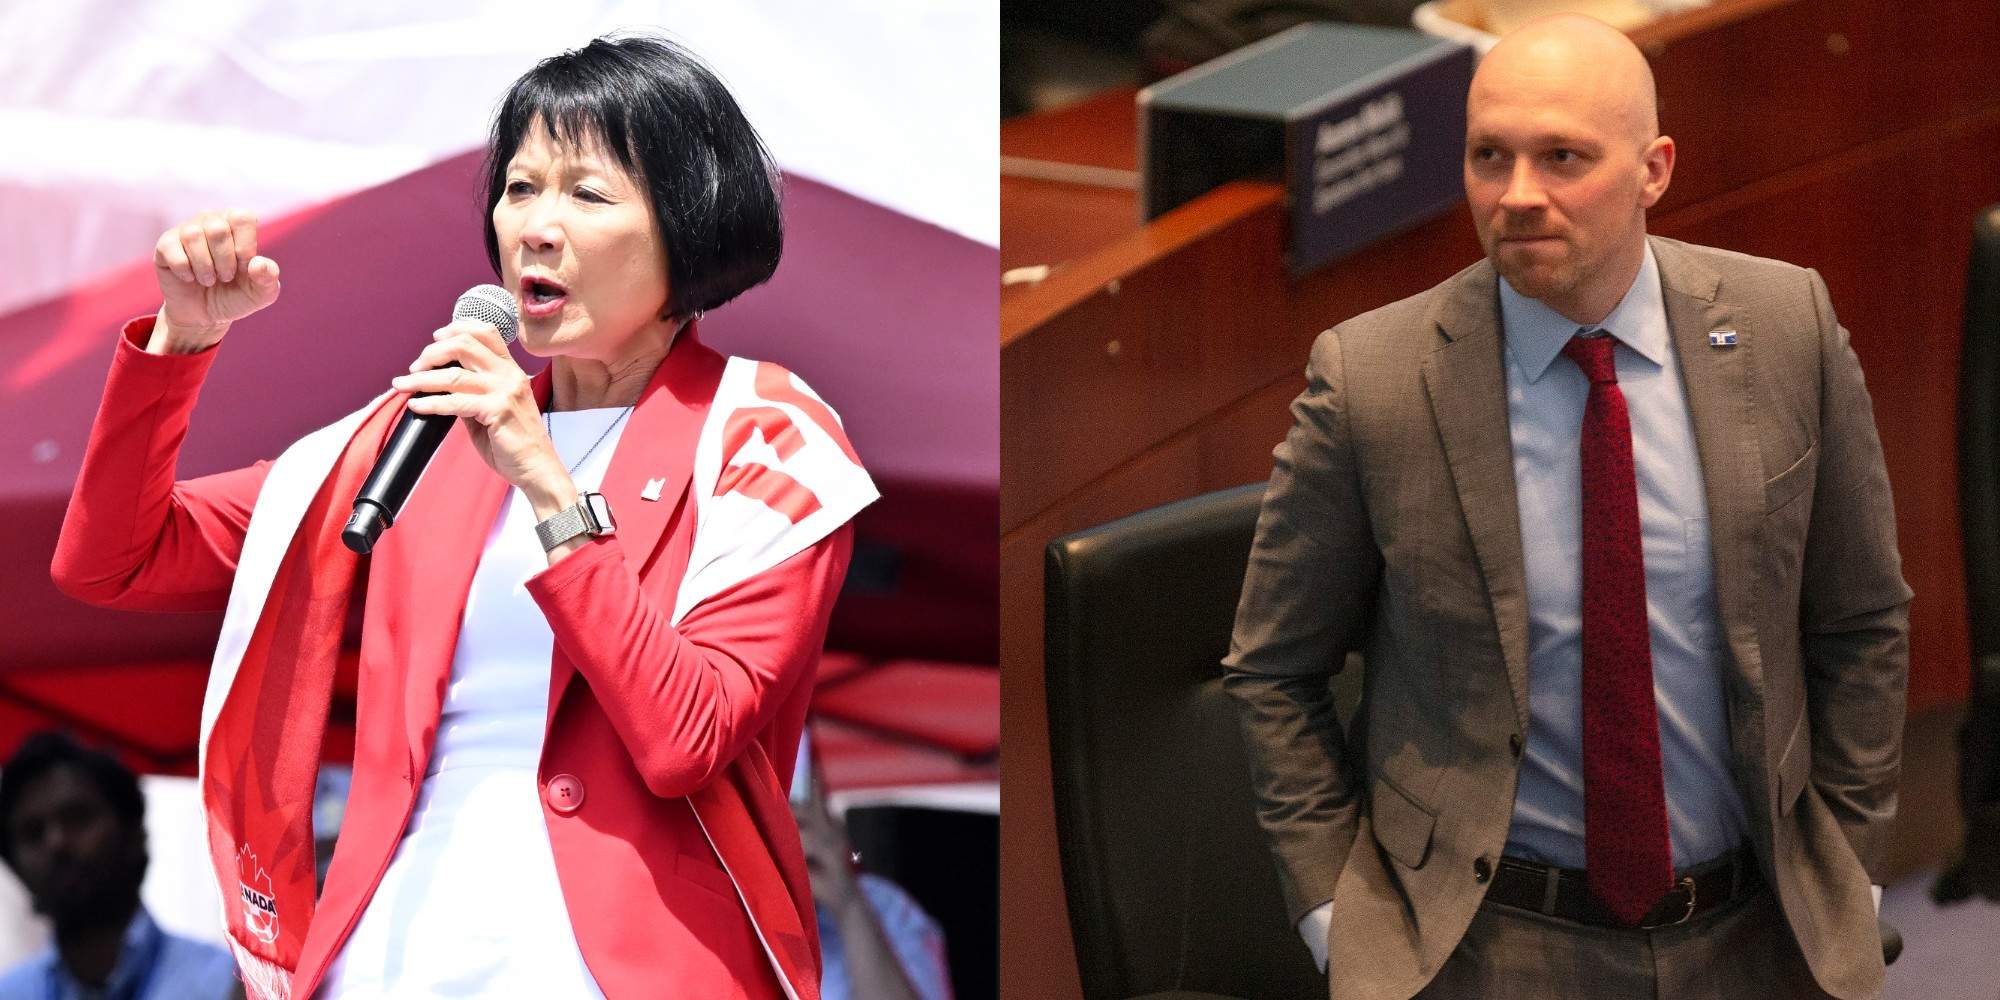
Headline polling claiming a statistical deadlock in the final days of the 2026 Toronto mayoral race between Olivia Chow and Brad Bradford misreads how survey margin of error interacts with unequal geographic turnout. When two candidates sit within a few percentage points in a citywide sample, standard horse-race coverage treats the race as a coin flip. That framing ignores a core structural reality of municipal politics: citywide topline percentages do not cast ballots; spatially concentrated voters in distinct regions of Toronto do.
Competing coverage of the race typically relies on a thin sequence of claims: a recent poll shows candidates neck-and-neck, undecided voters remain up for grabs, and the final stretch will decide everything. This analysis replaces that shallow narrative with a rigorous breakdown of how late-stage polling behaves in Toronto, why apparent deadlocks emerge, and which causal mechanisms actually govern the outcome. If you enjoyed this piece, you should read: this related article.
Deconstructing the Deadlock Narrative
Surface-level polling reports treat a tight spread as proof of an evenly matched contest. In statistical terms, a narrow lead inside a margin of error—such as a 3 to 4 percentage point gap when a poll's total-sample margin of error sits near plus or minus 3.6 percentage points—means the true population gap could be smaller, larger, or reversed by sampling noise alone. Calling that a "deadlock" confuses statistical uncertainty with behavioral equilibrium.
Conventional reporting usually misses four analytical distinctions: For another angle on this event, refer to the latest update from USA Today.
- Sample precision versus subsample variance: Topline margins of error apply to the full respondent pool, whereas regional cross-tabs (such as Downtown, Scarborough, North York, and Etobicoke) or narrowed pools of decided and leaning voters carry wider sampling error.
- Preference intensity versus ballot conversion: A respondent who names a preferred candidate in a survey does not carry the same probability of voting as a high-propensity voter who has already mapped out a trip to a polling station or returned a mail-in ballot.
- Undecided composition: Late-breaking undecided respondents rarely divide evenly by chance; their eventual choices correlate with existing ideological cues, incumbent evaluations, and late strategic consolidation.
- Spatial weighting sensitivity: Municipal polls must weight raw responses to match census and demographic benchmarks, yet actual election turnout diverges sharply across wards and historical cycles.
What is known with certainty from public polling methodology and Toronto election administration is how sampling error, voter eligibility, and regional vote shares operate. What remains an educated hypothesis in any pre-election snapshot is whether late-deciding respondents will break uniformly or cluster in specific districts, and how weather, advance-voting momentum, and ground mobilization will shift neighborhood participation.
The Turnout-Weighted Vote Function
To understand why a close citywide poll can mask a lopsided or spatially skewed result, model the final vote share as a turnout-weighted sum across Toronto's distinct geographic zones rather than a simple unweighted average.
In formal terms, a candidate's citywide vote share equals the sum across all geographic zones of each zone's turnout weight multiplied by that candidate's local vote share. If Zone A supplies a larger share of total ballots cast than Zone B, a strong lead in Zone A carries more mathematical weight than a comparable lead in a lower-turnout zone.
Historical Toronto municipal elections illustrate how uneven participation alters the math. Turnout jumped from a record-low 29% in 2022 to 38.5% in the 2023 mayoral by-election, and reached 45.84% in the October 26, 2026 election. Across those cycles, Downtown supplied a growing share of total ballots cast—rising from 37.2% in 2018 and 38.0% in 2022 to 39.7% in the 2023 by-election. When a high-turnout zone gives one candidate a wide margin, the challenger cannot offset that deficit simply by winning suburban wards by smaller margins.
Regional Coalitions and Ballot Friction
Toronto's political geography is not monolithic. Polling and election patterns consistently show sharp contrasts between the urban core, inner suburbs, and outer districts. In late October 2026 polling by Liaison Strategies, Olivia Chow held a commanding lead Downtown (60% to 35%) and an edge in Scarborough (51% to 44%), while Brad Bradford led in Etobicoke (54% to 41%) and North York (52% to 46%).
Notice the structural asymmetry in those numbers. A 25-point margin in a region generating roughly two-fifths of the citywide vote produces a massive raw-vote cushion. By contrast, single-digit or low-double-digit leads in regions with lower relative vote share require substantially higher local turnout just to break even on net votes.
Bradford's platform—emphasizing property tax freezes, water bill reductions, increased police staffing, transit reliability, and removing selected bike and bus lanes—targeted cost-of-living and commuter frictions that resonate strongly with car-reliant and suburban households. Chow's campaign—anchored in tenant protections, TTC fare affordability, and senior services—appealed heavily to renters, urban core residents, and progressive blocs. When a challenger's favorability trails their vote share, as late polling indicated for Bradford (40% favourable versus 49% unfavourable), part of the support rests on anti-incumbent or "change" sentiment rather than deep enthusiasm. Soft support is more vulnerable to late persuasion and turnout drop-off than high-intensity base support.
Ballot Crowding and Strategic Consolidation
Municipal ballots in Toronto feature large candidate fields—53 candidates ran for mayor in 2026. Even when minor candidates draw tiny individual percentages, crowded ballots create two operational effects:
- Name confusion and low-information noise: Candidates with similar names or minimal campaigns can siphon small fractions of ballots. In 2026, third-place finisher Braeden Chow received 0.82% of the vote, illustrating how ballot crowding registers even in a two-frontrunner race.
- Late strategic withdrawals: As poll spreads narrow or widen in the final weeks, trailing candidates or ideological allies sometimes exit to prevent vote splitting. Ahead of the 2026 vote, Chris Alexander ended his campaign after the withdrawal deadline (remaining on the ballot), and candidate Odessa Paloma Parker withdrew to back Chow.
These mechanics explain why polling in the final days often shows movement that looks dramatic in headlines but reflects small shifts among a shrinking pool of undecided voters (down from 14% to 6% in one late October survey).
The Cost Function of Late-Stage Campaigning
In the final days before an election, every campaign faces a binding resource constraint: time, volunteers, paid media budget, and voter contact capacity are fixed, while the marginal return on each additional dollar or door knock declines as the election approaches. Treating the final week as an all-purpose persuasion sprint misallocates scarce capacity.
Campaign operations in the closing window are governed by three cost-and-return trade-offs:
- Persuasion cost versus turnout yield: Convincing a firm supporter of the rival candidate to switch sides in the final 72 hours carries a high marginal cost and low conversion rate. Turning out a soft supporter or leaning voter who already prefers your platform yields a much higher return per contact.
- Geographic contact density: Dense urban neighborhoods allow high door-knocking and transit-stop contact rates per volunteer hour, whereas spread-out suburban wards require more travel time per household, raising the logistical cost of physical canvassing.
- Advance-vote lock-in: Once advance ballots are cast during the designated voting window (October 6 to October 11 in the 2026 cycle), those votes are banked and removed from the persuadable pool. Campaigns that fail to mobilize early in high-propensity precincts risk leaving persuasion resources aimed at voters who have already voted.
What Actually Decides Close Municipal Races
When pollsters report a tight race days before election day, four causal levers determine whether the final tally matches the perceived deadlock or breaks decisively:
- Differential regional turnout: If high-margin regions for one candidate turn out at higher rates than high-margin regions for the other, the citywide percentage shifts even if regional preference shares stay unchanged.
- Late break of undecideds: A small undecided slice—often 5% to 10% in final polls—can swing a close race if it breaks two-to-one toward either the incumbent or the challenger.
- Demographic participation gaps: Age and gender divides (such as leads among women or specific age cohorts) only translate into votes if those groups show up at the polls at modeled rates.
- Survey mode and likely-voter modeling: Automated voice (IVR), online panels, and live telephone or mixed-mode surveys weight turnout probability differently. Differences of 6 to 10 points across concurrent late polls often reflect screeners and weighting models rather than real-world swings.
The 2026 election itself demonstrated how late-stage polling narratives can diverge from final outcomes. While several late-October polls showed single-digit leads for Chow—ranging from 6 to 10 points—and earlier coverage highlighted tightening or neck-and-neck dynamics, actual election-day results on October 26 gave Chow 54.16% (532,201 votes) to Bradford's 41.11% (404,013 votes), a 13.05-point margin across 982,660 total ballots cast.
Methodological Limitations and Blind Spots
Even disciplined polling and spatial modeling have clear boundaries. Municipal elections lack party labels on the ballot in Toronto, making turnout prediction harder than in partisan provincial or federal contests where party infrastructure maintains detailed voter rolls. Furthermore, polls capture a snapshot of stated intent under hypothetical turnout assumptions; an unexpected weather shift, a late news event, or a surge in same-day registration at polling stations can alter actual participation after fieldwork closes. No analytical model eliminates sampling variance or behavioral surprises.
Strategic Play for Closing the Gap
For a campaign operating inside the final 72 hours of a tight Toronto mayoral race—or an analyst evaluating late-stage polling claims—the single highest-leverage move is to reallocate ground and get-out-the-vote resources strictly by net-vote elasticity rather than polling headlines.
Execute that shift through four concrete steps:
- Rank polls by subsample and likely-voter screen, not headline spread: Discount single-survey "deadlock" claims when a lead sits inside the margin of error, and track multi-poll averages alongside regional cross-tabs to see where raw vote margins are widest.
- Concentrate field hours in high-margin, high-yield precincts: Deploy volunteers and direct outreach where your candidate already holds strong support and where incremental turnout produces large net-vote gains, rather than chasing low-probability conversions in hostile territory.
- Audit advance-vote data against election-day targets: Compare early-voting shares by region against historical benchmarks so election-day mobilization fills remaining regional deficits instead of repeating effort in already-banked pockets.
- Tighten the closing message around a single high-salience trade-off: In the final days, voters rarely absorb a ten-point policy manifesto; focus communications on the one core cost, safety, or governance contrast that motivates undecided leaners to actually walk into a voting location.