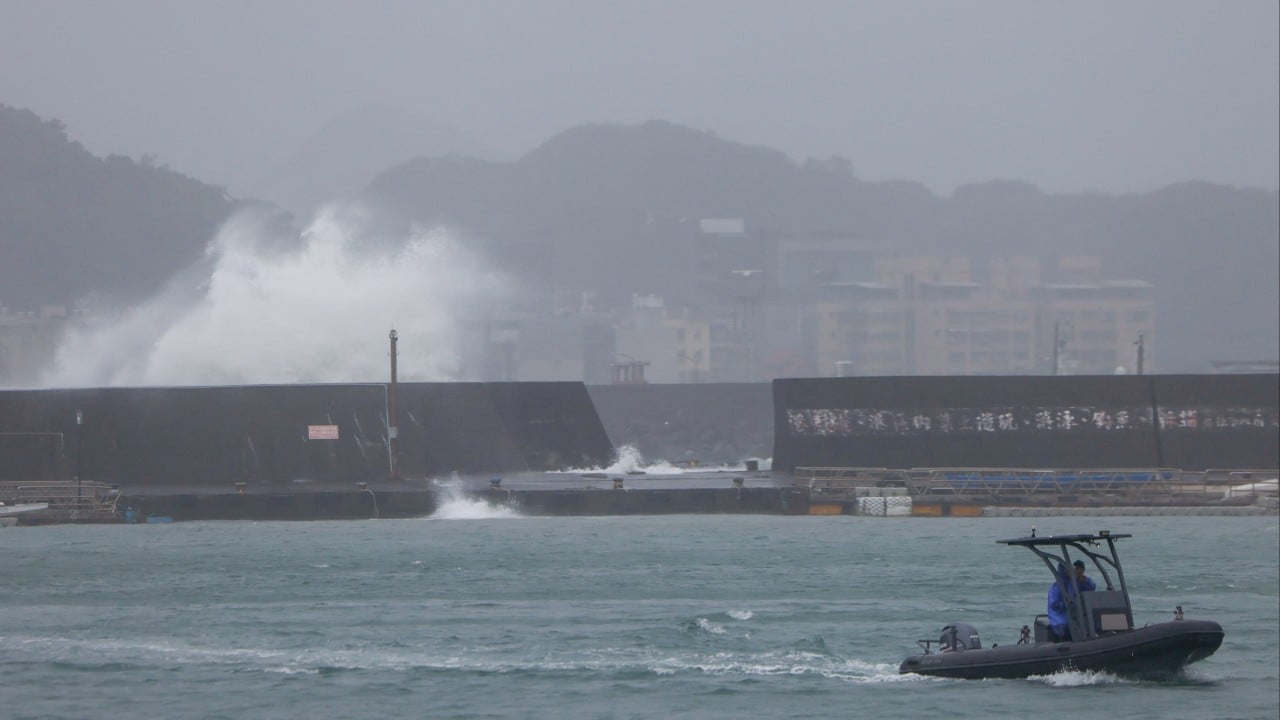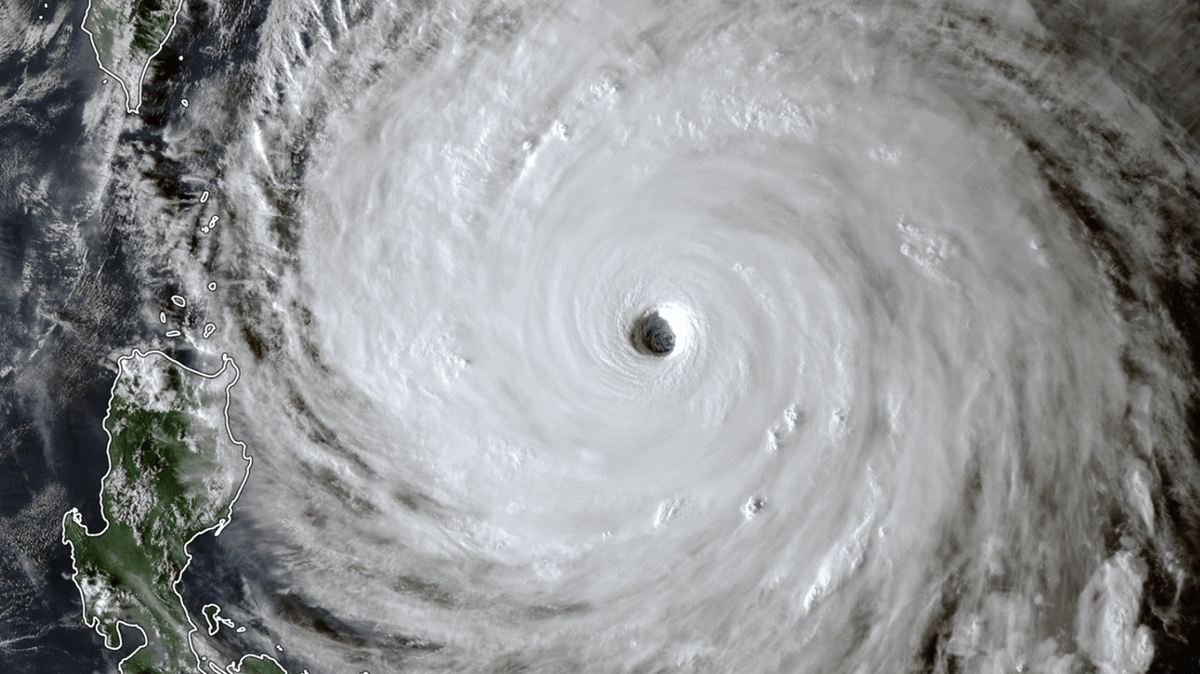
A single severe tropical cyclone can ground roughly 1,000 flights in a matter of hours, yet the true economic shock of a typhoon shutdown lies in network propagation and recovery lag rather than the storm's immediate landfall. When headline reporting stops at "Taiwan shuts down ahead of Typhoon Champi" and tallies cancelled departures, it treats aviation and civic closures as isolated events. In reality, a major storm triggers a coupled failure across airport ground operations, commercial airspace routing, industrial manufacturing shifts, and municipal transit. Understanding how these layers interact—and where standard reporting misses the causal chain—requires examining the mechanics of preemptive shutdowns, fleet scheduling constraints, and post-storm recovery curves.
Deconstructing Headline Reporting and Hidden Causal Chains
Standard news coverage of a typhoon shutdown typically follows a predictable script: meteorologists issue warnings, local authorities suspend schools and offices, airlines cancel hundreds of flights, and travelers face disruption. That framing captures visible symptoms while obscuring the underlying structural dynamics. A cancellation count is a point-in-time snapshot, not a measure of total system strain. One cancelled round-trip flight removes two legs from a carrier's schedule; when that aircraft is out of position at a diverted or closed station, it breaks subsequent rotations across multiple days.
To evaluate a competitor's headline framing rigorously, separate what is directly observable from what requires causal modeling:
- Known facts in a standard disruption report: Official storm warnings, declared work or school suspensions, announced flight cancellations, and temporary port or rail closures.
- Educated hypotheses and analytical inferences: How long backlog clearance will take, which supply chain tiers face inventory depletion, and how passenger rebooking cascades across partner carriers.
- Unstated structural mechanisms: Aircraft and crew rotation coupling, runway crosswind and visibility thresholds, industrial clean-room or power-grid protocols, and asymmetric recovery speeds between air, rail, and road networks.
A common analytical error is assuming that flight cancellations happen solely because planes cannot fly in high winds. While surface wind speed, wind shear, and heavy rain directly affect approach and takeoff safety, preemptive cancellations often occur well ahead of peak gusts. Airlines pull schedules early to reposition aircraft out of the storm path, protect crews from exceeding duty-time limits during irregular operations, and avoid stranding passengers at terminals when ground transport stops running.
The second mechanism headline tallies miss is asymmetric network propagation. Taiwan sits inside dense East and Southeast Asian trunk corridors connecting Northeast Asia, Southeast Asia, and North America. A wave of nearly 1,000 cancelled flights at major hubs disrupts not only local origin-and-destination passengers but also transit flows and cargo belly capacity. Even after wind speeds subside and runways reopen, the aviation network operates under slot, gate, and crew constraints that cap hourly recovery throughput far below normal peak capacity.
The Three Pillars of a Preemptive Typhoon Shutdown
A comprehensive shutdown ahead of a typhoon rests on three operational pillars: Safety Margin Enforcement, Asset and Workforce Preservation, and Demand and Mobility Suppression. None of these pillars operates in isolation, and tension between them shapes the severity of the disruption.
Safety Margin Enforcement
Meteorological forecasts carry spatial and intensity uncertainty until the storm is close enough for high-resolution radar and reconnaissance tracking. Aviation and civil authorities manage that uncertainty by imposing hard operational thresholds rather than waiting for catastrophic conditions to materialize. Air traffic control adjusts arrival and departure spacing, suspends visual approaches, or halts operations altogether when crosswinds, gusts, or visibility breach safe limits. Rail and port operators apply analogous wind and wave thresholds to prevent derailments, overhead line faults, or vessel allisions.
Asset and Workforce Preservation
High-value physical assets and specialized personnel require advance preparation before severe weather arrives. Airlines move aircraft to inland or out-of-sector airports when storm tracks threaten severe surge or extreme gusts, while staggering crew pairings so pilots and cabin crews remain legal and rested for recovery flying. On land, industrial plants, construction sites, and logistics hubs secure cranes, stabilize materials, and shift staff out of exposed transit routes. Protecting human safety is the primary objective, and reducing commuter volume directly lowers accident risk during hazardous weather.
Demand and Mobility Suppression
Government declarations suspending work and classes act as an immediate demand brake on urban mobility. When offices, schools, and non-essential services pause, morning and evening commuter peaks vanish. That suppression relieves pressure on local buses and metro lines during the worst weather, yet it simultaneously compresses commercial activity into a shorter window before and after the storm. Retailers, service businesses, and logistics operators must decide whether to absorb lost daily revenue or surge activity before landfall and immediately after clearance.
The Disruption Cost Function and Bottleneck Mechanics
Analysts often treat disruption cost as a simple function of storm intensity multiplied by duration. In practice, the cost function is non-linear and convex: doubling the duration or severity of an operational halt more than doubles total economic and operational friction once buffer capacities are exhausted.
Consider the primary variables driving the cost function during a major typhoon event:
- Cancelled flight volume and seat-kilometers lost: Direct measure of immediate air transport contraction, though blind to load factors and cargo tonnage.
- Aircraft and crew out-of-position lag: The number of airframes and crews stranded away from planned bases, which governs how quickly schedules can be rebuilt.
- Terminal and ground-side queue density: Passenger accumulation inside concourses and ground transport bottlenecks when flights cancel late or mass rebooking begins.
- Workday and shift interruption hours: Lost productive hours across commerce, services, and manufacturing, offset partially by remote work or rescheduled shifts.
- Supply chain and inventory buffer depth: The ability of factories, warehouses, and retail shelves to absorb multi-day freight or component delays without halting lines.
Consider a simplified conceptual example of bottleneck dynamics. Suppose an international hub normally handles 60 movements per hour during peak banks and cancels 950 flights over a two-day storm window. Once the storm passes, the airport cannot simply add 950 extra flights on top of normal schedule on day three. Airspace sector capacity, curfews, gate availability, ground handling staffing, and crew duty limits cap the surplus recovery flights that can be layered onto regular operations each day. A backlog of that scale typically clears across several days rather than overnight, creating rolling delays even on clear-weather days.
This bottleneck creates a secondary effect that headline numbers rarely capture: schedule compression and cascading misconnects. As airlines insert recovery sections and rebook stranded passengers onto remaining seats, load factors climb toward maximum capacity. Any minor technical delay, late inbound turn, or air traffic flow restriction during the recovery phase then ripples across tightly packed bank structures with minimal slack.
Sectoral Exposure Across Aviation, Logistics, and Commerce
Different sectors experience a typhoon shutdown through distinct operational vulnerabilities. Comparing exposure across aviation, freight logistics, and local commerce clarifies why a single headline number—such as nearly 1,000 cancelled flights—cannot serve as a proxy for the entire economy.
Commercial Aviation and Passenger Networks
Commercial airlines face immediate revenue loss on unflown legs, higher per-passenger rebooking and accommodation costs during irregular operations, and complex schedule recovery math. Hub-and-spoke and point-to-point carriers alike must balance passenger goodwill against operational feasibility. Cancelling flights early reduces airport crowding and allows proactive rebooking, whereas rolling delays trap passengers in terminals and strain ground crews.
Air Cargo and High-Value Supply Chains
Air freight operates under tight transit windows, especially for time-sensitive electronics components, pharmaceuticals, and perishables. Even when passenger demand dips or shifts, cargo capacity matters because widebody passenger aircraft carry a substantial share of regional air freight in their lower holds. When passenger flights are cancelled in bulk, belly-hold capacity contracts sharply, forcing freight forwarders to compete for scarce dedicated freighter space or shift to maritime and multimodal alternatives where transit times are longer.
Urban Commerce, Services, and Industrial Operations
Local service sectors—food service, retail, hospitality, and leisure—face immediate demand drops during active shutdown hours, with only partial recovery afterward because a missed restaurant meal or same-day service visit is rarely made up in full. Industrial and logistics operations face a different trade-off: high-precision or continuous processes cannot always be switched off and back on instantaneously without calibration, inspection, or material waste. Facilities with robust contingency plans manage shutdowns through pre-storm staging, shift adjustments, and post-storm safety checks before resuming full output.
Limitations of Standard Disruption Metrics and Forecasting
Relying on headline cancellation counts or single-point storm forecasts introduces predictable analytical blind spots. Both policymakers and business leaders make poorer decisions when they treat proxy metrics as complete indicators of system health.
First, raw cancellation counts conflate scale with severity. Nine hundred cancelled flights at a major multi-runway hub with high frequency and abundant alternative routing has a different operational profile than a similar disruption concentrated in thin regional markets or isolating an island network with limited surface substitutes. Second, aggregate figures hide distributional winners and losers. A traveller whose flight is cancelled a day ahead and moved to a morning departure experiences an inconvenience; a shipper missing a critical production window or a hourly worker losing shift pay faces material loss.
Third, meteorological and operational forecasts degrade under compounding uncertainty. Storm tracks can shift, intensities can fluctuate rapidly, and post-storm recovery depends on human and infrastructure variables—such as power restoration, flood clearance, and crew legalities—that are harder to model than wind speed alone. Any analytical framework that claims exact financial or timeline precision during an active storm overstates what can be known in real time.
Tactical Playbook for Navigating Severe Weather Shutdowns
Translating this analysis into action requires separating pre-storm containment, active-storm stabilization, and post-storm recovery. Each phase has distinct decision rules for travelers, operations leaders, and analysts.
- Audit exposure before landfall: Map active itineraries, critical shipments, and on-site staffing against the storm's projected wind and rain window, prioritizing movements that sit on single-point-of-failure routes or tight connection windows.
- Execute early schedule and routing adjustments: Shift non-essential travel or freight ahead of the storm's arrival window or reroute through unaffected hubs before schedule cuts peak and rebooking inventory tightens.
- Lock in contingency buffers during active closures: Establish clear communication checkpoints for crews, employees, and customers; verify facility safety and utility status; and avoid committing to rigid delivery promises until official reopening criteria are met.
- Prioritize high-value and time-critical flows first during restart: When airports, ports, and roads reopen, sequence recovery around safety verification, crew and asset positioning, stranded passengers with missed connections, and high-priority freight rather than treating all backlog items as equal.
- Track recovery velocity rather than initial cancellation counts: Monitor on-time departure performance, rebooking clearance rates, and backlog burn-down over the 72 hours after conditions normalize to judge true operational stabilization.
Strategic Recommendation for Resilience Planning
Organizations operating in typhoon-exposed regions should stop benchmarking weather resilience by how quickly they cancel operations and start measuring how quickly they restore throughput per hour after clearance. Preemptive shutdowns are necessary and effective for protecting lives and physical assets, so resilience gains rarely come from delaying protective closures. Instead, the decisive strategic advantage lies in building post-storm recovery slack: maintaining flexible crew and shift rosters, pre-positioning critical inventory and spare parts outside immediate flood or wind corridors, keeping automated rebooking and dispatch workflows ready before disruption peaks, and setting realistic customer and partner expectations around multi-day backlog normalization. In severe weather events, the organization that restores reliable flow fastest—without sacrificing safety margins—captures the durable operational edge.